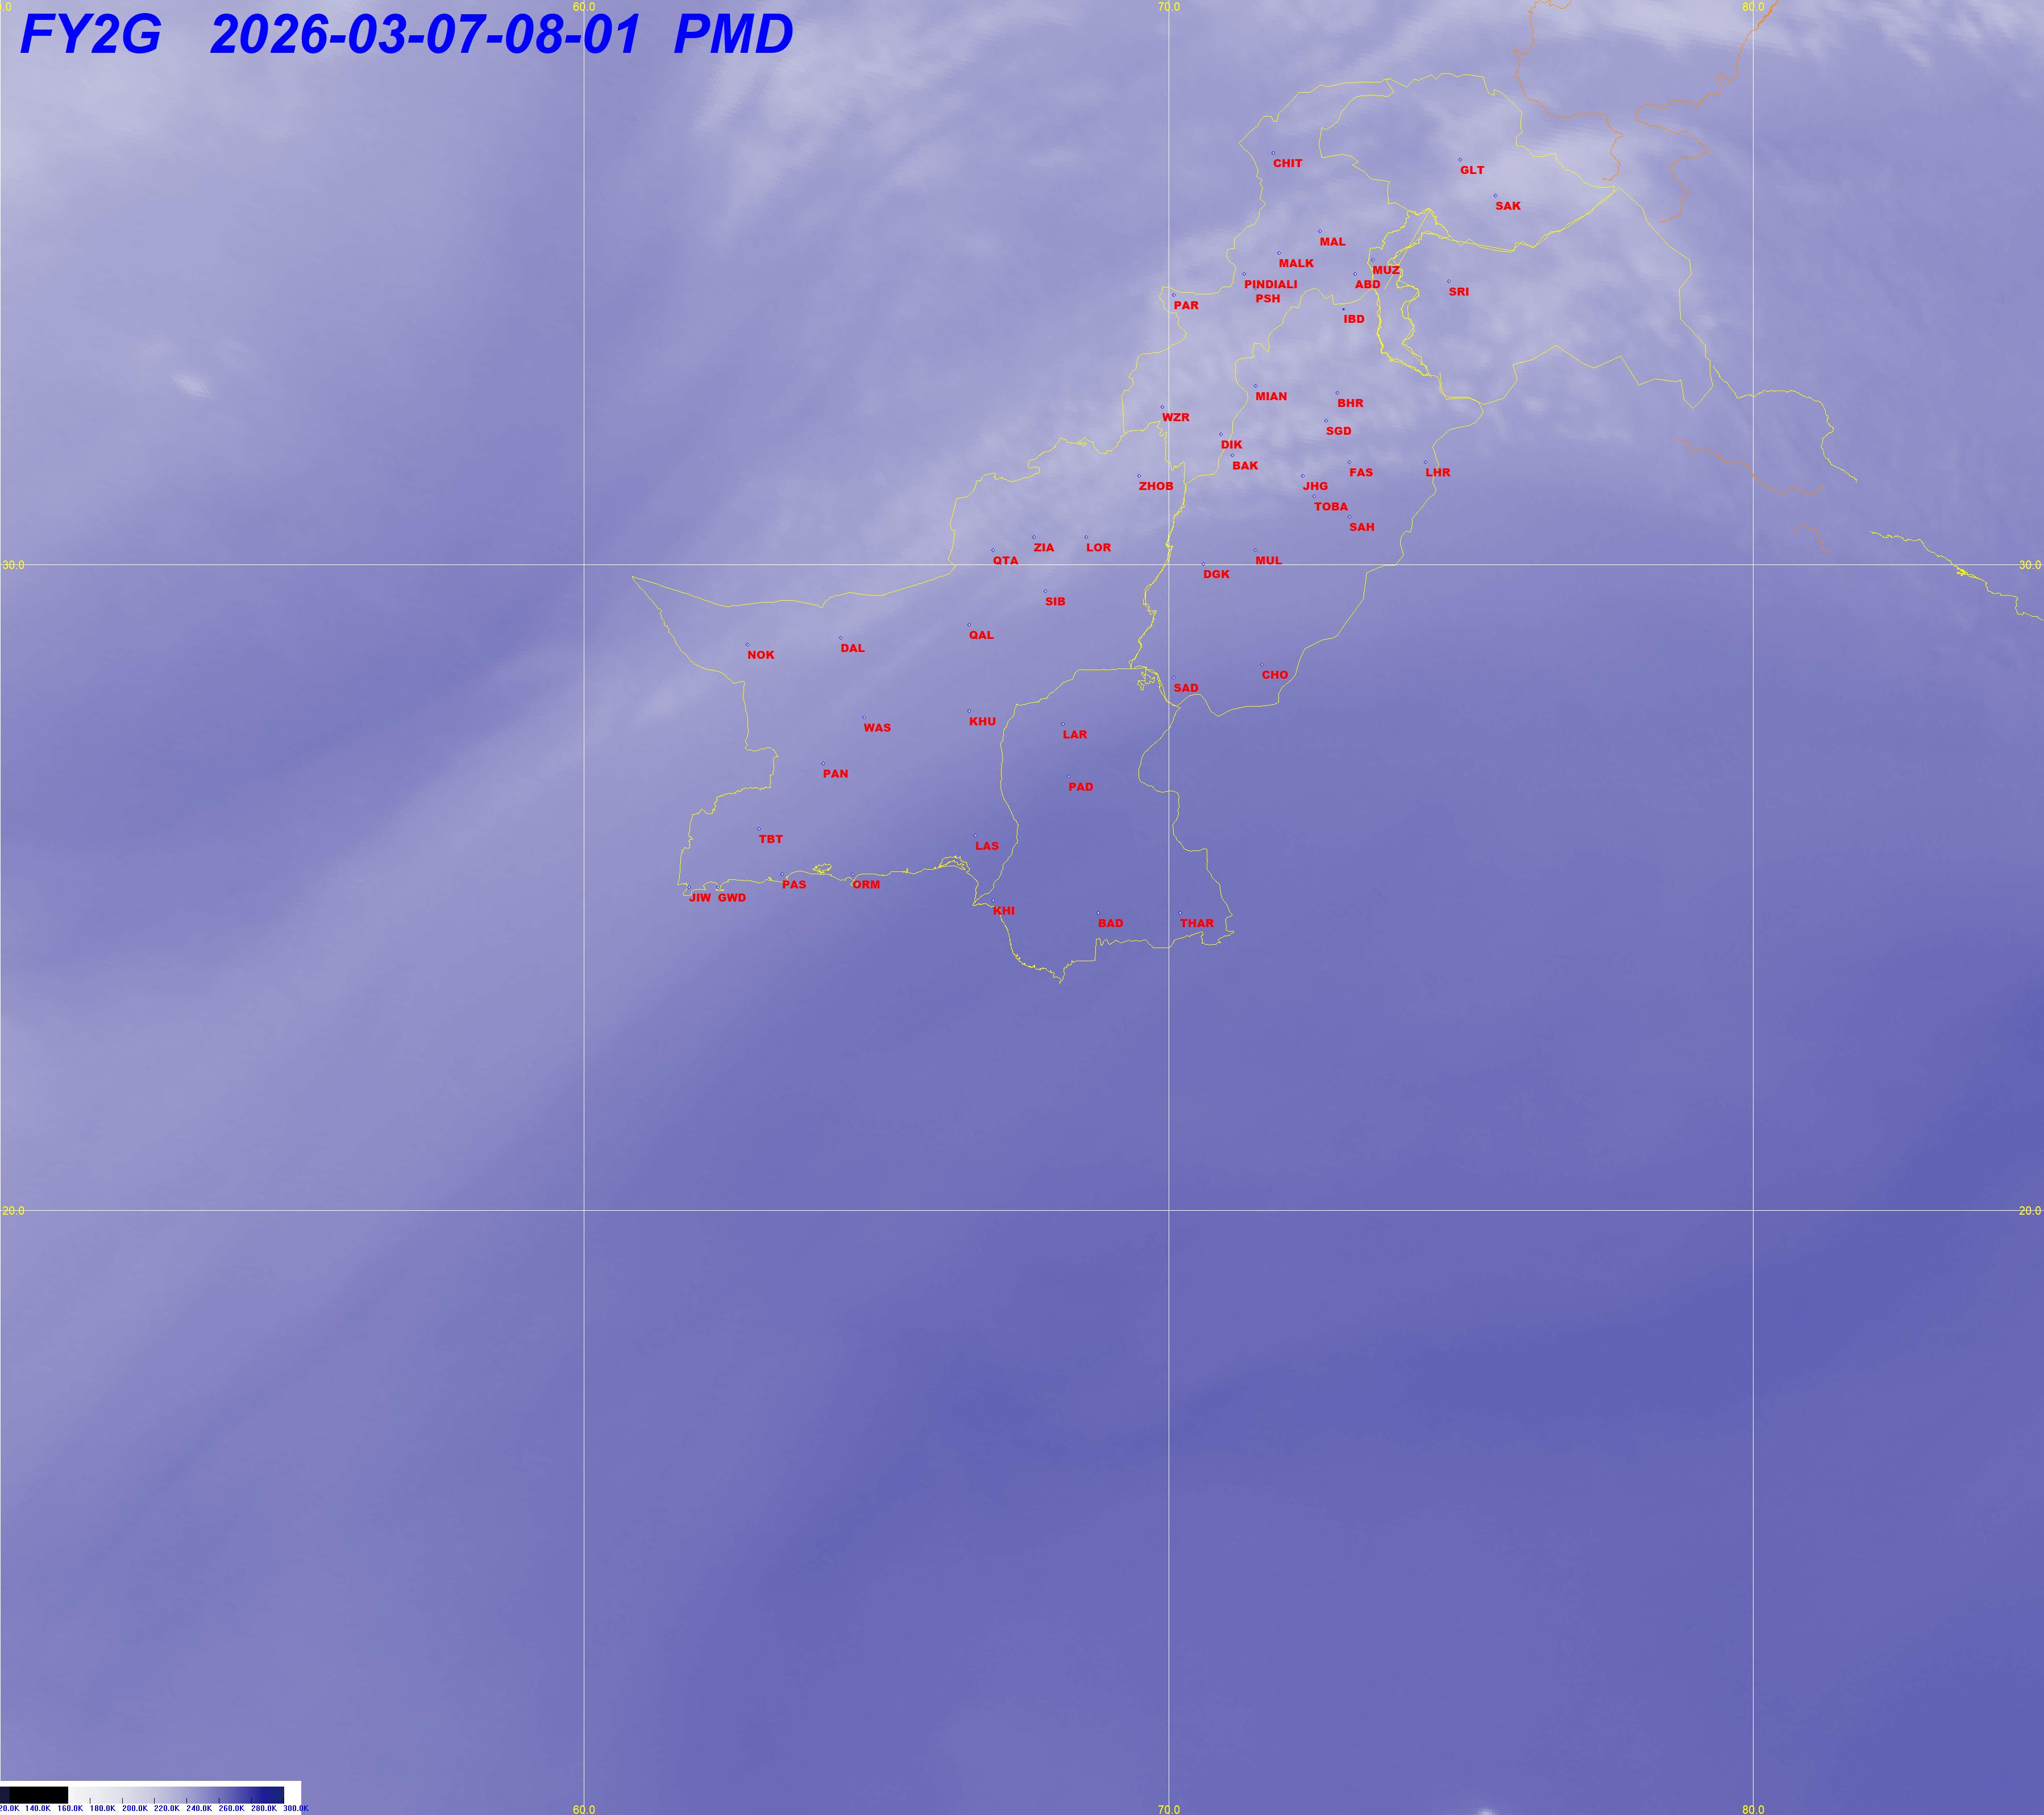
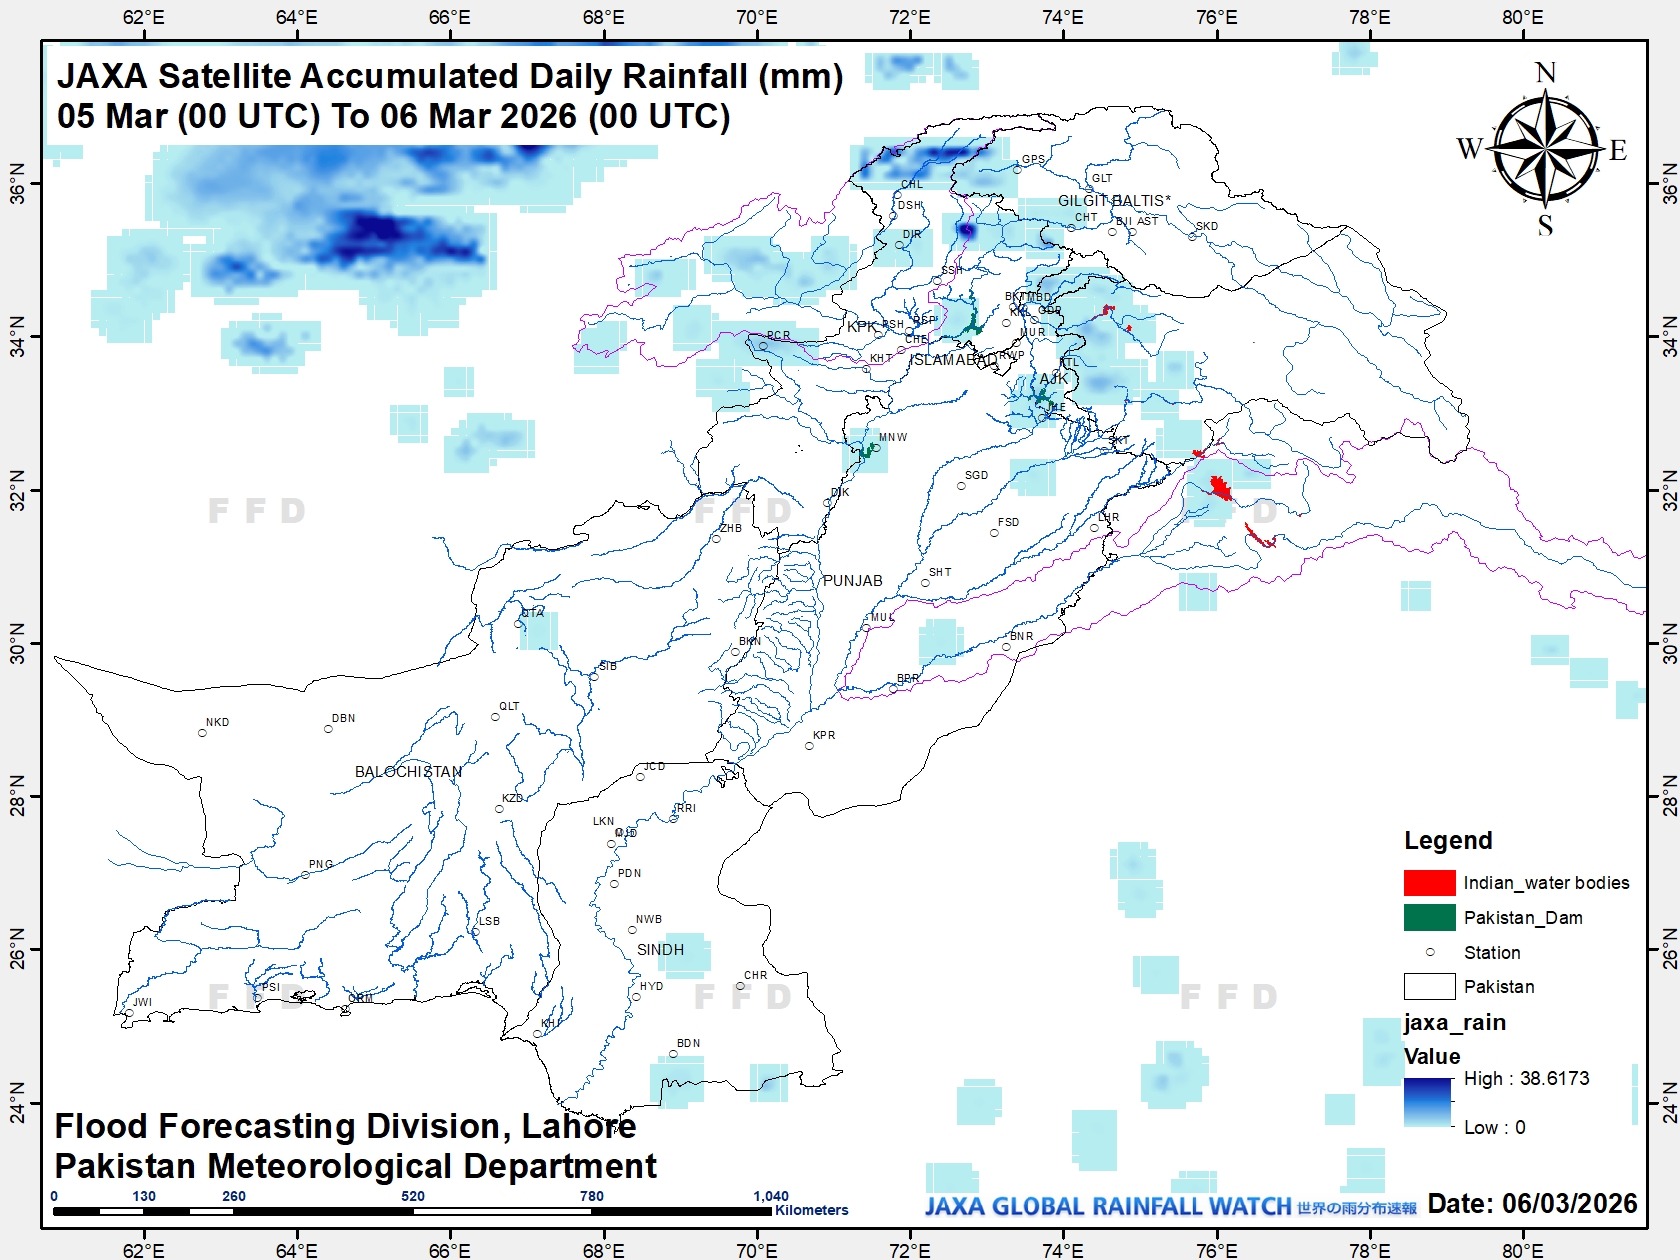
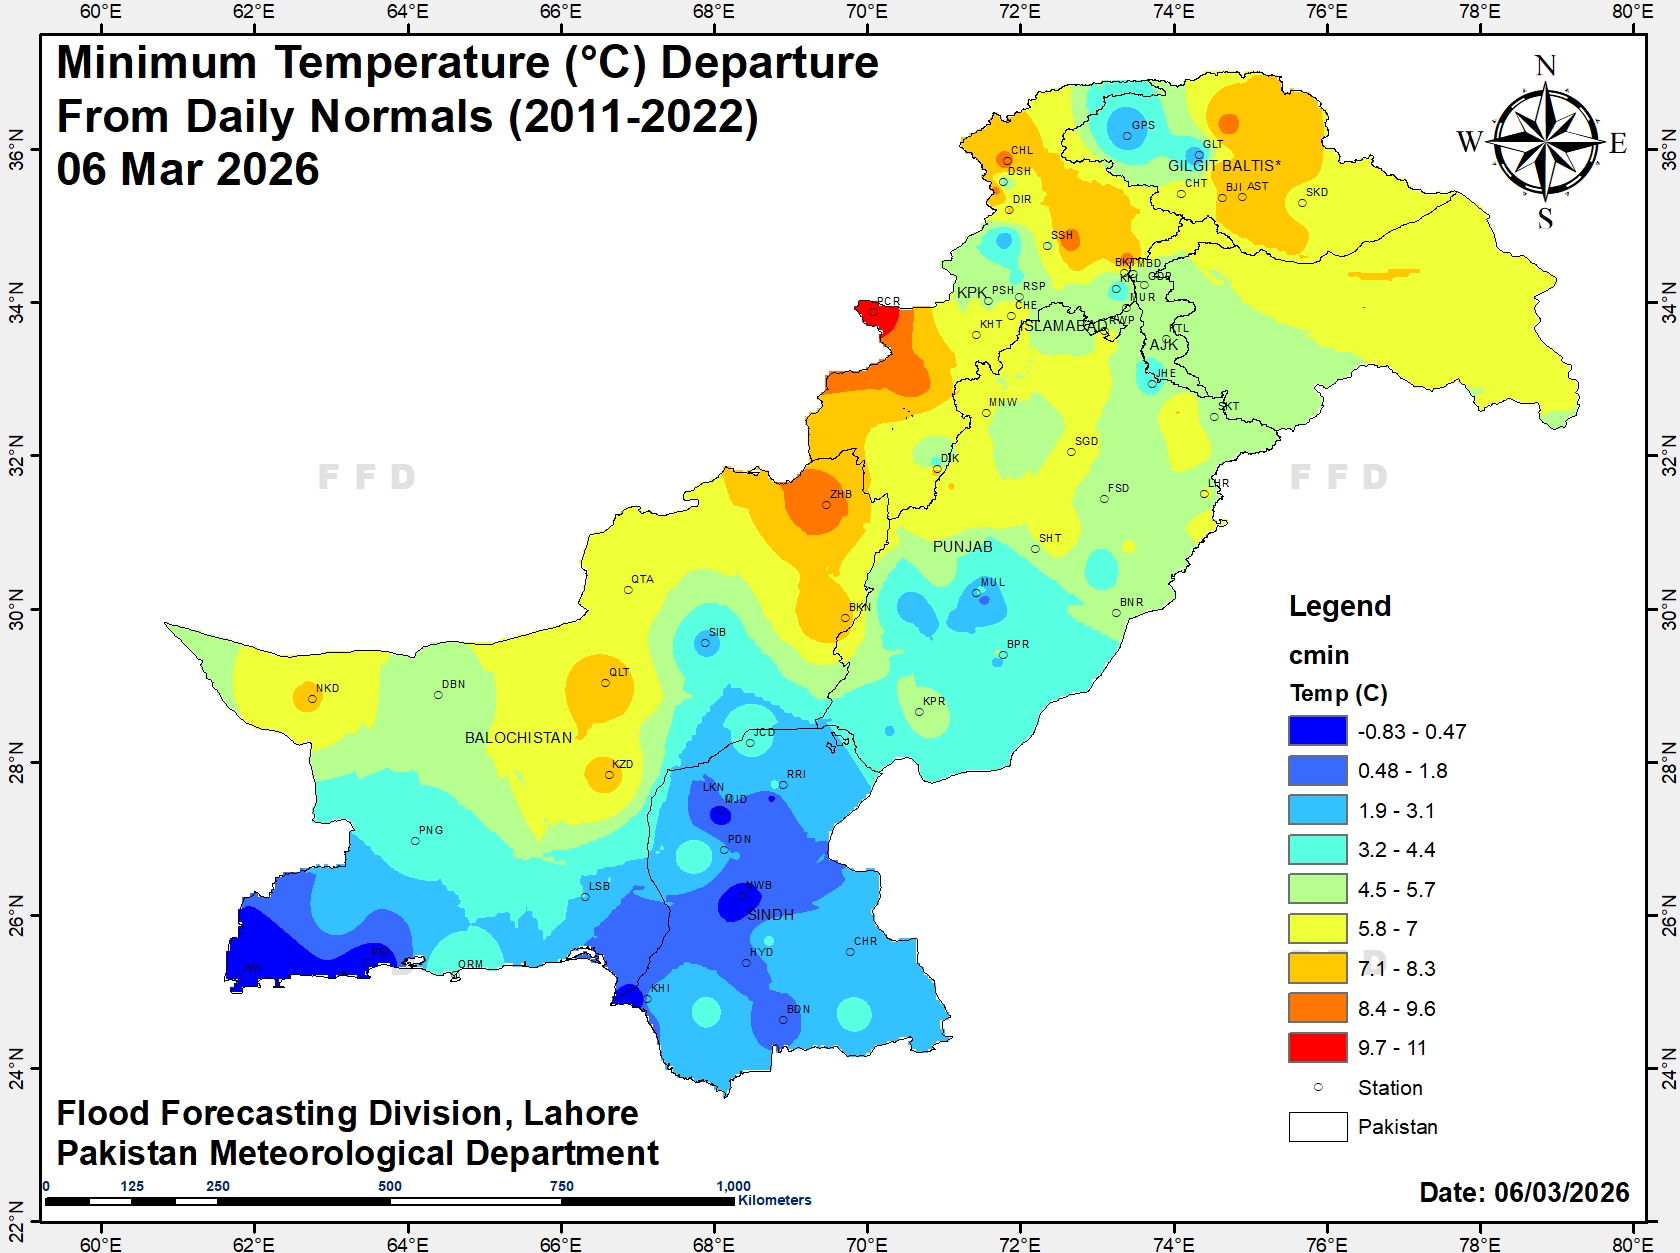
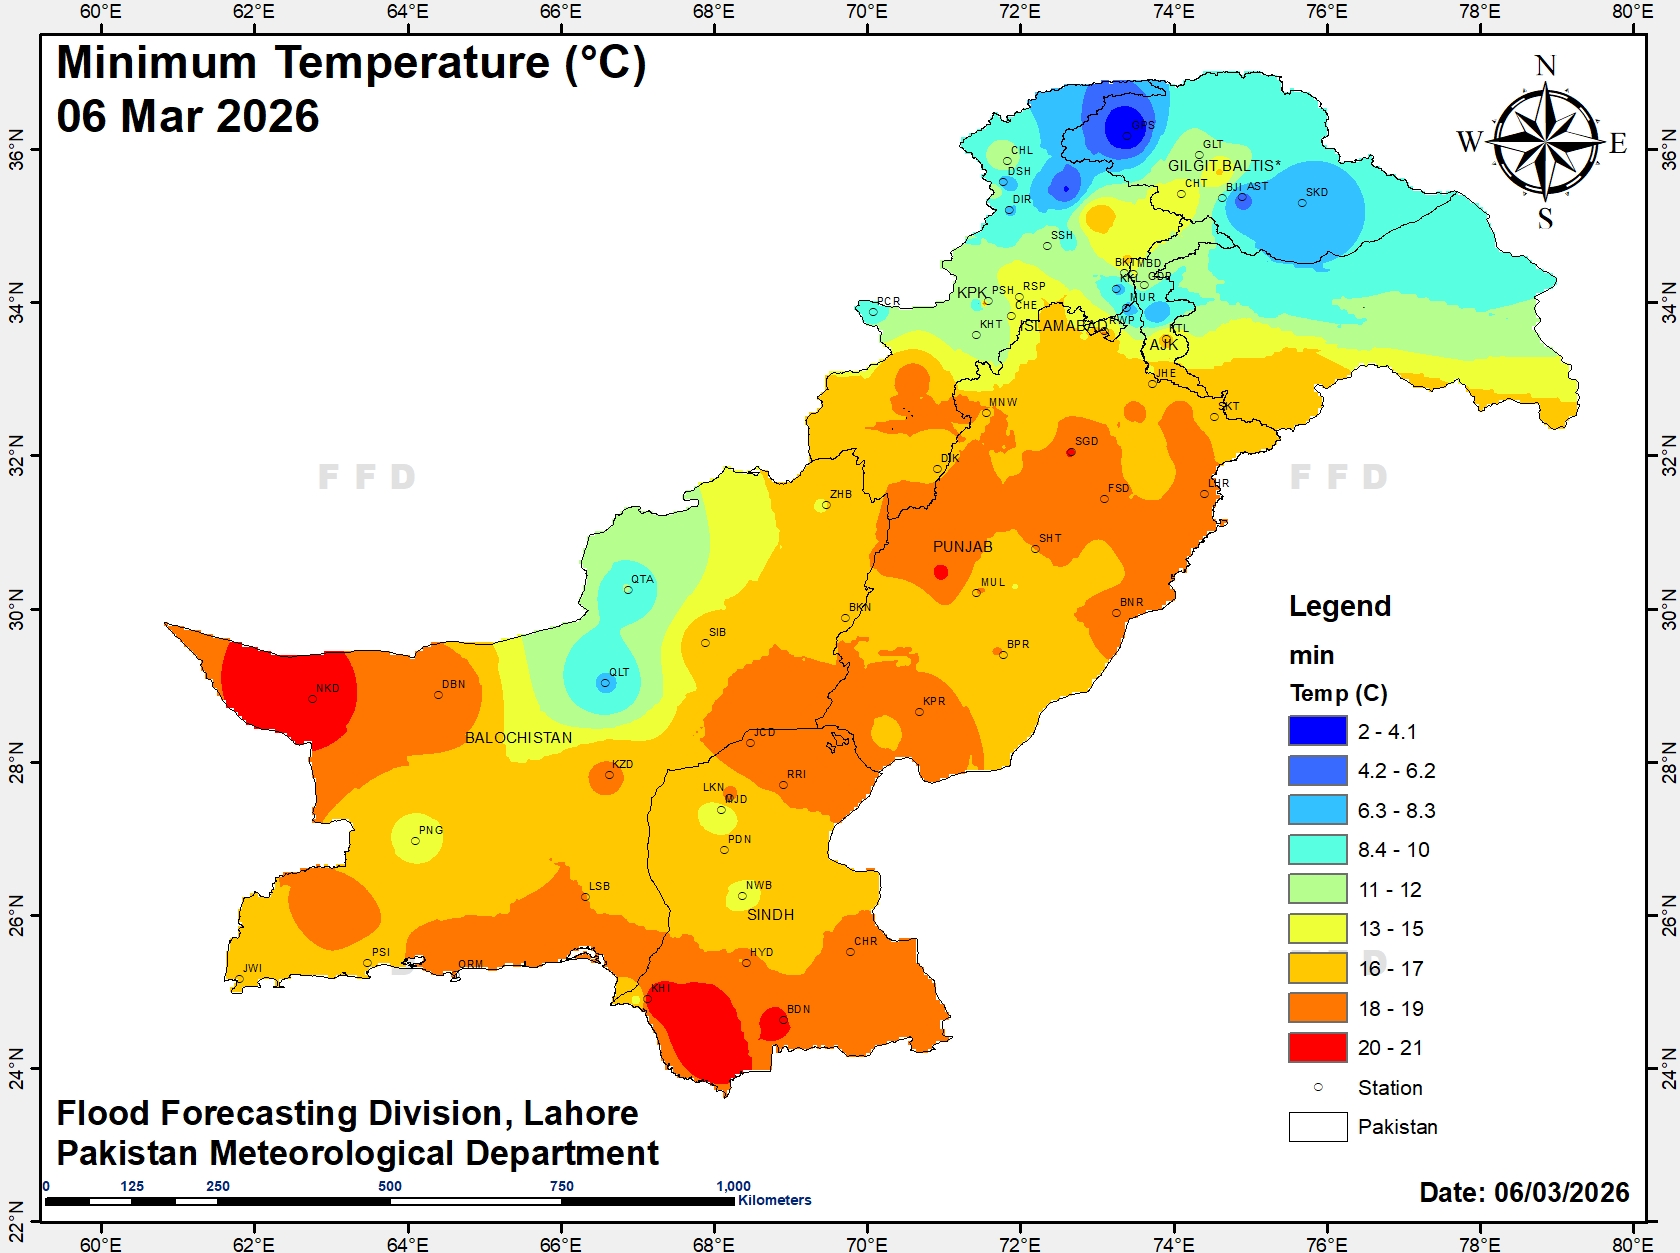
FFD Dashboard

Flood Forecasting Dashboard is interface of comprehensive overview of FFD data from different sources. It is useful for useful for monitoring, measuring, and analyzing relevant data in key areas. FFD dashboard is composed of following seven sections

Section 1: Catchment Forecast

Catchment forecast section location at top most. This section contains the prediction of atmospheric conditions for the Upper Catchments of major rivers of Pakistan. This section is updated daily between 10:00 AM to 12:00 AM or when there is a condition in the basin that changes abruptly and is not covered in the forecast

Section 2: River System

River System section is located on left side under catchment forecast section. This section contains three images. 1. Catchment Map: the maps of upper catchment Area of the river Kabul, and Indus. It also include the catchment of Jhelum, Chenab, Ravi and Sutlej. These catchment has been extracted by 30 meter SRTM data set by using ARCGIS tools. 2. Time-Lag: the lag time for different reaches, which shows the old and latest lag times of from barrage to barrage. These lag time has been revised by FFD experts using 20 years data of flood.3. Indus River Network: the map of indus river network by using dynamic layout. Which shows the current flows at different structures. This layaout is updated after every 6 hours during the season (15 Jun to 15 October) and updated once rest of the year.

Section 3: Hydrological data

Hydrological data section is located on middle of page, under catchment forecast section. This section contains the latest values from river points received from multiple sources (WAPDA, Irrigation and Police department).

Section 4: Meteorological data

Meteorological data section is located on right of page, under catchment forecast section. This section contained the current synoptic situation within the country. Pakistan meteorological Department has 114 observatories all over Pakistan. The current synoptic data (Pressure Change, Maximum Temperature, Minimum Temperature, Humidity, and Visibility), is use to interpolate over whole Pakistan by using GIS IDW and Kriging interpolation technique.

Section 5: Reservoirs Section

This section is located right below section 2. This section contains current status of reservoir Tarbela and Mangla and water availability forecast during the Rabi and Kharif Seasons.

Section 6: Reservoirs Daily Comparison

This section is located right below section 4. This section contains current day level comparsion of reservoir Tarbela and Mangla using data from last 10 years.

Section 7: Current Weather Section

This section is location on bottom most of the page. This section contains the latest meteorological parameters of cities.

Porto Welcome to Flood Forecasting Division (FFD), Lahore
28 May 2023

Catchment Forecast

Visit our Website